gmr_bands.box
Sketch of bands for a ferromagnetic conductor
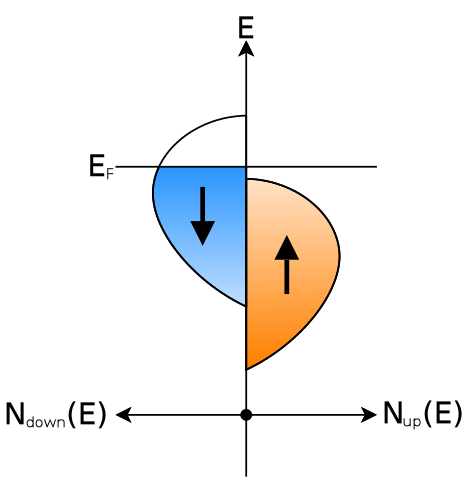
Just one more example. To run this example you will need the following file(s): ./gmr_bands.box. If the example requires more than one file, then you should put them into the same directory. You can then launch Box/Boxer with box -l g ./gmr_bands.box or boxer ./gmr_bands.box.
//!BOXER:VERSION:0:1:1

include "g"
GUI = Void
Window@GUI[]

//!BOXER:REFPOINTS:BEGIN
gui1 = Point[.x=5.85241203518, .y=-31.8482116959]
gui2 = Point[.x=50.1205662252, .y=41.9938810345]
gui3 = Point[.x=-8.39314978723, .y=-21.3932506964]
gui4 = Point[.x=-13.7070768212, .y=48.8614910448]
gui5 = Point[.x=65.6334487097, .y=-35.6355089552]
gui6 = Point[.x=-8.90201744681, .y=20.622321727]
gui7 = Point[.x=73.0256757447, .y=-2.54990306407]
gui8 = Point[.x=89.8183085106, .y=5.34393175487]
gui9 = Point[.x=87.7828378723, .y=29.5347158774]
gui10 = Point[.x=72.2623742553, .y=29.7893557103]
gui11 = Point[.x=27.7364540426, .y=-13.7540557103]
gui12 = Point[.x=27.7364540426, .y=-3.05918272981]
gui13 = Point[.x=37.4049395745, .y=-13.2447760446]
gui14 = Point[.x=37.1505057447, .y=27.4975972145]
gui15 = Point[.x=34.8606012766, .y=4.07073259053]
gui16 = Point[.x=20.6123068085, .y=12.2192072423]
//!BOXER:REFPOINTS:END
include "arrows"

d = 0.3

band = Window[][
  pi = Point[gui7], pf = Point[gui10]
  Poly[Style[Border[color.black, d]]
       pi, 0, 1, gui8, 0.5, gui9, 1, 0, (pi.x, pf.y)]
  Hot[pi]
]

w = Window[][
  BBox[gui4, gui5]
  p1 = Point[gui1], p2 = Point[gui2], o = Point[gui3]
  ef = Point[gui6]
  o.x = 0.5*(p1.x + p2.x)
  Gradient[Line[gui13, gui14], Color[(1, 0.5, 0)], color.white]
  Put[band, "t", Near[0, (o.x, Point[gui11].y)]]
  Gradient[Line[gui13, gui14], color.white, Color[(0, 0.5, 1)]]
  Put[band, "t", Scale[(-1, 1)], Near[0, (o.x, Point[gui12].y)]]
  Poly[(p1.x, ef.y), (p2.x, ef.y), p2, (p1.x, p2.y), color.white]
  Color[.a=0]
  Put[band, "t", Near[0, (o.x, Point[gui11].y)]]
  Put[band, "t", Scale[(-1, 1)], Near[0, (o.x, Point[gui12].y)]]

  color.black
  Lines[d, color.black, (o.x, p1.y), Scale[0.9], arrow, (o.x, p2.y);
        arrow, (p1.x, o.y), arrow, (p2.x, o.y);
        (p1.x, ef.y), (p2.x, ef.y)]
  Circle[o, 1]
  Texts[Font["sans", 5]
        (p2.x, o.y), From[(-0.1, 0.5)], "N_{up}(E)";
        (p1.x, o.y), From[(1.1, 0.5)], "N_{down}(E)";
        (o.x, p2.y), From[(0.5, -0.1)], "E";
        (p1.x, ef.y), From[(1.1, 0.5)], "E_F"]
  p = Point[gui15], v = (0, 5)
  Line[color.black, 0.8, p - v, Scale[1.4], arrow_triangle, p + v]
  p = Point[gui16]
  Line[color.black, 0.8, p + v, Scale[1.4], arrow_triangle, p - v]

]

w.Save["gmr_bands.png", Window["rgb24", .Res[Dpi[150]]]]
w.Save["gmr_bands.pdf"]

GUI[w]
